3 Signs You Have Outgrown SugarCRM Reporting
SugarCRM is equipped with powerful reporting tools that allow you to query the data in your CRM to track Key Performance Indicators (KPIs), create dashboards and reports based on specific criteria. Sugar provides users with the ability to generate rows and columns, summation, and matrix reports. Furthermore, in Enterprise and Ultimate editions, Advanced Reporting gives you the ability to create reports using SQL.
The ability to query CRM data is the cornerstone of effective insight into the health of your business. So how do you know if you’ve outgrown Sugar’s out-of-the-box reporting features?
You want to merge and join data from multiple modules
Sugar reports requires users to choose a primary module with which to build reports. All reportable fields from that module are available, but to access data in modules other than the base module, you must explicitly create relationships between them. Additionally, related fields are often buried and cannot be summarized using computed derivatives. Advanced reports allow for more flexibility in this area, but require users to know SQL.
You want to perform advanced analysis
Sugar summation reports can be turned into charts and dashboards. However, you may be left wanting interactive dashboards that allow you detailed drill downs and aggregations without having to change the parameters of the report. In addition, you may be limited by the lack of computed derivatives, flexibility for analysis across date ranges (e.g. year-over-year comparisons), and lack of chart types that help you gain important insights into your performance.
You want to export aggregated data
Sugar’s export option allows for summation reports to be downloaded as .csv files. Other report types can be exported as .pdfs, for sharing with non-Sugar users. However, the need to export aggregated data for sharing or analysis outside of your CRM may arise.
What’s the solution?
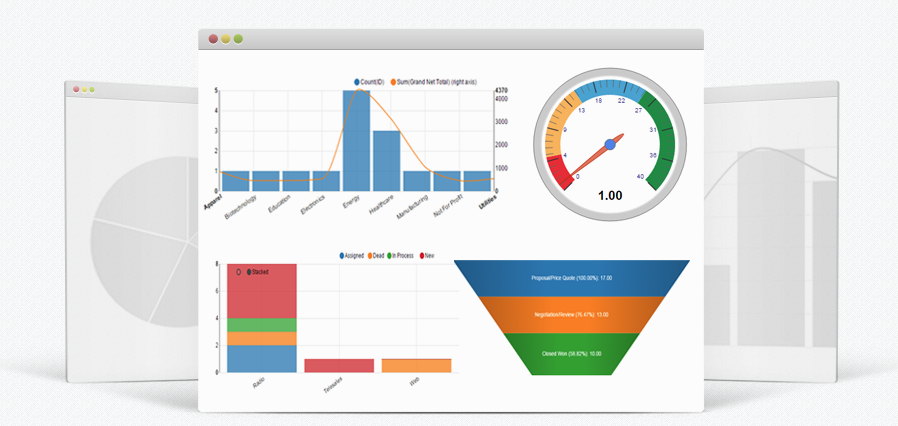
Join us at 10 am EST on July 23rd for our webinar exploring IT Sapiens’ Analytic Reporting tool for SugarCRM. With this powerful BI plug-in, you’ll be able to address the above limitations and more! Analytic Reporting allows you to modify reports and charts with advanced filtering, sorting, and grouping criteria. Reports are easily modified with simple clicks and instantaneous aggregations, even using calculated fields. No SQL required! In addition, IT Sapiens provides users with a vast array of beautiful interactive charts and graphs including three axis charts, geographic charts, funnel, area charts, and gauge reports; all while integrating seamlessly into SugarCRM.
Check out this short video of the tool in action.

Stay in the Loop
Subscribe to get all our latest content sent directly to your inbox!
Ready to rock? So are we!